

The carbon footprint of solar energy refers to the total greenhouse gas emissions produced throughout a solar panel’s entire lifecycle, from raw material extraction and manufacturing through installation, operation, and eventual disposal. While solar panels generate clean electricity for 25 to 30 years without direct emissions, their production does require energy and materials that create an upfront carbon cost.
Here’s what the numbers tell us: manufacturing a typical residential solar panel system produces roughly 40 to 80 grams of CO2 equivalent per kilowatt-hour over its lifetime. Compare that to coal power at 820 grams per kWh or natural gas at 490 grams, and the picture becomes clear. Solar panels “pay back” their manufacturing emissions within one to four years, depending on location and panel type, then provide two decades or more of truly clean energy.
This matters because the carbon footprint really tells us whether our climate solutions actually work. Many people worry that solar panel production might offset the environmental benefits, or wonder if different panel types carry different carbon costs. The short answer: solar energy remains one of the lowest-carbon electricity sources available, even when accounting for every stage of production.
This article breaks down exactly where emissions occur in the solar lifecycle, compares carbon footprints across panel technologies, and shows you how to evaluate the true environmental impact of solar energy. You’ll get concrete data, not vague promises, about what going solar means for your carbon footprint.
What Carbon Footprint Really Means for Solar Panels
When we talk about the carbon footprint of solar panels, we’re measuring the total greenhouse gas emissions created throughout the panel’s entire existence, not just when it’s sitting on your roof. This includes everything from mining the raw materials to the eventual recycling or disposal decades later.
Think of it as the complete environmental story of your solar system. Most people assume solar panels have zero emissions because they generate clean electricity once installed, but that misses the bigger picture. The manufacturing process requires energy, often from fossil fuel sources. Shipping panels from factories to your location burns fuel. Even the installation crew driving to your home adds a small amount to the total.
Here are the key concepts you’ll encounter when evaluating solar’s carbon footprint:
- Embodied Carbon
- The total greenhouse gas emissions produced during manufacturing, including extracting silicon and metals, processing them into panels, and assembling all components. This represents the largest portion of solar’s lifetime carbon footprint.
- Lifecycle Emissions
- The sum of all carbon emissions from every stage, manufacturing, transport, installation, operation, maintenance, and end-of-life disposal or recycling. This complete view typically ranges from 20-50 grams of CO2 per kilowatt-hour generated.
- Carbon Payback Period
- The time it takes for a solar panel to generate enough clean electricity to offset the emissions from its production. Most modern panels achieve this within one to four years of a 25-30 year lifespan.
- Operational Emissions
- The carbon produced while panels actively generate electricity, which is essentially zero. Sunlight converts to electricity without burning fuel or releasing greenhouse gases.
Understanding these stages helps you see solar’s true environmental impact. The good news? Nearly all of solar’s carbon footprint happens upfront, then the panels spend decades producing emissions-free electricity that offsets far more carbon than their production created.
How Solar Energy’s Carbon Footprint Works Through Its Lifecycle
Manufacturing and Materials
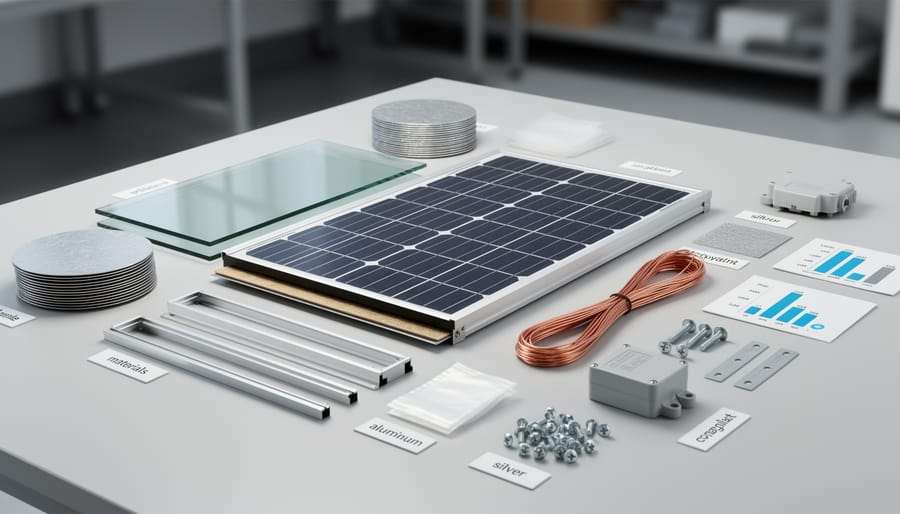
The manufacturing stage accounts for the largest share of solar panels’ lifetime carbon emissions, roughly 60-80% of the total footprint. This concentration happens because creating solar panels requires energy-intensive processes and raw material extraction.
Silicon production sits at the heart of most solar panels. Manufacturers must heat quartz to extremely high temperatures (around 2,000°C) to produce metallurgical-grade silicon, then further refine it to solar-grade purity. This refining process traditionally consumed significant amounts of electricity. The metals used in solar cells, primarily silver for electrical contacts and aluminum for frames, also require energy-intensive mining and processing. Glass production for protective panel coverings adds another layer of emissions, though it’s less carbon-intensive than silicon processing.
Where panels are manufactured makes a substantial difference. A panel produced in a region powered by coal generates roughly twice the carbon emissions of an identical panel made using renewable energy. China currently dominates solar manufacturing and has been shifting its production facilities toward cleaner energy sources. European manufacturers often tout lower carbon footprints due to stricter environmental standards and cleaner grids.
Recent improvements are cutting manufacturing emissions steadily. New production techniques use less energy, recycled silicon reduces the need for virgin material extraction, and some manufacturers now power their facilities with renewable energy. These advances have reduced the typical manufacturing carbon footprint by approximately 20-30% over the past decade.
Transportation and Installation
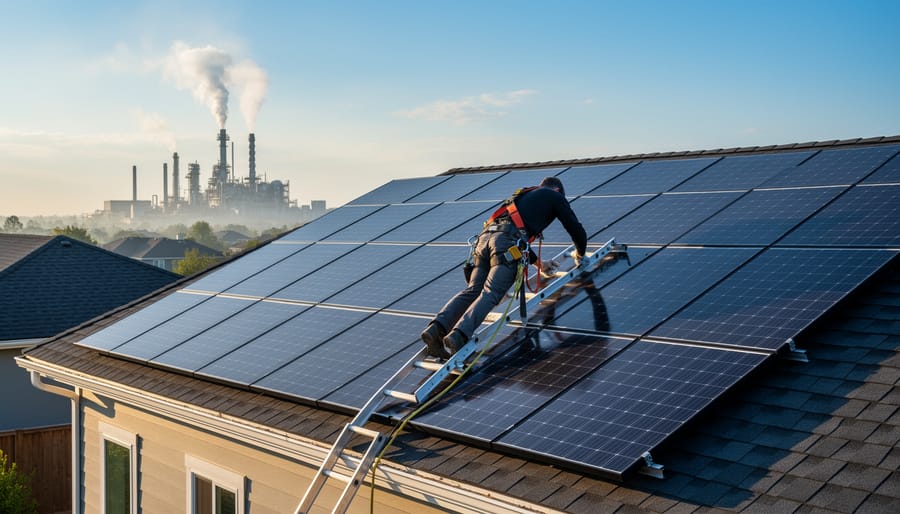
Shipping solar panels from manufacturing facilities to installation sites contributes modestly to the overall carbon footprint, though the impact varies significantly based on distance and transport method. Panels manufactured in Asia and shipped to North America or Europe accumulate more transportation emissions than locally-produced alternatives. Ocean freight remains the most carbon-efficient option for international shipments, while truck transport for regional distribution adds incremental emissions.
Beyond the panels themselves, the balance-of-system components, inverters, mounting hardware, wiring, and racking systems, require separate transportation, each adding to the shipping footprint. These components often come from different suppliers, creating multiple shipping routes that compound emissions.
The installation phase introduces additional carbon through equipment use and worker transportation. Cranes, lifts, and power tools consume fuel or electricity during the days or weeks of installation. Installation crews traveling to and from the site daily contribute vehicle emissions, though this impact remains relatively small in the lifecycle calculation.
Despite these factors, transportation and installation typically account for only 5-10% of solar energy’s total lifecycle emissions. The manufacturing stage dominates the carbon budget, meaning shipping distances and installation practices have limited influence on the overall environmental profile of a solar system.
Operation and Maintenance
Once solar panels are up and running, they produce electricity without burning fuel or emitting greenhouse gases. There’s no combustion, no chemical processes, and no direct carbon output during operation. The panels simply convert sunlight to power, silently and cleanly.
Maintenance needs are minimal, typically limited to occasional cleaning and inspections. Even when panels require professional service the carbon footprint is negligible, a service visit might involve a technician’s vehicle emissions, but spread across decades of operation and thousands of kilowatt-hours generated, the impact rounds to nearly zero. This near-absence of operational emissions is what makes solar’s carbon payback period so favorable compared to any fossil fuel alternative.
End-of-Life and Recycling
When solar panels reach the end of their 25-30 year lifespan, how they’re handled significantly affects their total carbon footprint. Decommissioning itself produces minimal emissions, panels are simply disconnected and removed. The real carbon impact comes from what happens next.
Historically, many panels ended up in landfills, wasting valuable materials and contributing unnecessary emissions. Today, recycling is transforming this final stage. Modern recycling facilities can recover up to 95% of a panel’s materials, silicon, glass, aluminum frames, and copper wiring, dramatically reducing the need for virgin material extraction in future panels.
Here’s why this matters for carbon footprint: recycling a panel avoids the manufacturing emissions associated with producing new materials. Glass and aluminum, which make up about 80% of a panel’s weight, require substantial energy to manufacture from scratch but far less when recycled.
The challenge? Recycling infrastructure is still developing in many regions, and the process itself requires energy. However, as recycling becomes more widespread and efficient, it’s expected to shave 10-15% off solar’s lifecycle carbon footprint. Some manufacturers now design panels specifically for easier disassembly and recycling, further improving end-of-life environmental outcomes.
Different Types of Solar Technology and Their Carbon Profiles
Not all solar panels carry the same carbon footprint, the type of technology you choose affects both the manufacturing emissions and how quickly your system offsets those initial costs.
Monocrystalline panels, recognizable by their uniform black appearance, represent the most energy-intensive manufacturing process. Creating these panels requires growing single silicon crystals at extremely high temperatures, which demands substantial electricity. However, they deliver 20-22% efficiency or higher, meaning they generate more power per square meter than other types. This efficiency advantage helps them recover their manufacturing emissions faster, typically within two to three years, despite their carbon-heavy production. For residential installations with limited roof space, this trade-off often makes sense.
Polycrystalline panels use a simpler manufacturing approach. Instead of growing individual crystals, manufacturers melt silicon fragments together, which requires less energy and produces less waste. The result is panels with a distinctive blue, speckled look and slightly lower efficiency (15-17%). Their manufacturing footprint runs about 10-15% lower than monocrystalline, but the reduced efficiency means you’ll need more panels to generate the same power. The carbon payback period ends up similar, around three years, making them a solid middle-ground choice where space isn’t constrained.
Thin-film panels represent the lowest manufacturing footprint, using significantly less material and lower-temperature processes. These flexible panels can incorporate various materials like cadmium telluride or amorphous silicon, and their production emits roughly 30-40% less carbon than crystalline options. The catch? Efficiency typically hovers around 10-12%, so you need substantially more surface area. Thin-film makes sense for large commercial roofs or ground-mounted arrays where space is abundant, but the efficiency penalty often extends the carbon payback period to four years or more.
Recent innovations are narrowing these gaps. Manufacturers increasingly use renewable energy in production facilities, and advances in thin-film efficiency continue closing the performance gap. The “best” technology depends on your specific situation: available space, local climate, and how long you plan to keep the system. All three types deliver dramatically lower lifetime emissions than fossil fuel alternatives, the differences between them matter less than the decision to go solar in the first place.
The Numbers: What Solar’s Carbon Footprint Actually Looks Like
Now that you understand how solar panels generate emissions across their lifecycle, let’s look at the actual numbers. Solar energy produces approximately 20 to 50 grams of carbon dioxide equivalent per kilowatt-hour (gCO2e/kWh) over its entire lifespan. To put that in perspective, that’s roughly the same carbon output as boiling water for a single cup of tea spread across generating enough electricity to power your home for an hour.
The specific number within that range depends on several factors: the type of panel, where it was manufactured, how sunny your location is, and how long the system lasts. Monocrystalline panels manufactured in regions with cleaner energy grids tend toward the lower end, while less efficient panels produced with coal-heavy electricity push toward the higher end.
Here’s what the research shows about solar’s carbon profile:
- Lifecycle emissions: 20-50 gCO2e/kWh on average, with newer systems trending toward the lower end
- Carbon payback period: 1 to 4 years, meaning the system offsets its manufacturing emissions in this timeframe
- Lifetime savings: A typical residential system prevents 100 to 200 tons of CO2 over 25-30 years
- Household context: Installing solar is equivalent to removing 1-2 cars from the road permanently
The carbon payback period deserves special attention because it reveals solar’s environmental value proposition. In sunny regions like California or Arizona, a solar system can offset its entire manufacturing footprint in just one to two years. In cloudier climates, it might take three to four years. After that payback point, every kilowatt-hour generated is essentially carbon-free for the remaining 20-plus years of the system’s life.
What makes these numbers particularly meaningful is the cumulative effect. A single 6-kilowatt home system generating electricity for 25 years typically prevents the equivalent emissions of burning 10,000 gallons of gasoline. That’s not a projection or best-case scenario, it’s the documented performance from existing installations measured against their local grid’s fossil fuel mix.
How Solar Energy Is Used and Why It Matters for Overall Carbon Impact
Residential Solar Applications
Home rooftop solar systems typically offset 3-8 tons of CO₂ annually, depending on system size and your local electricity grid’s carbon intensity. A 6kW residential system in a coal-heavy grid state might prevent 7 tons of CO₂ per year, while the same system in a region with cleaner grid power offsets around 4 tons. This difference matters because solar’s environmental benefit comes from replacing whatever energy source your utility would otherwise use.
Your carbon payback period, the time it takes for your panels to offset their manufacturing emissions, ranges from 1-4 years for typical home installations. After that, every kilowatt-hour generated is genuinely carbon-negative compared to grid power. Systems paired with battery storage can maximize this offset by capturing excess solar production that would otherwise go unused, especially in areas where net metering isn’t available or where time-of-use rates incentivize self-consumption.
Commercial and Industrial Uses
Commercial and industrial solar installations typically achieve carbon payback in 1-2 years, faster than residential systems, because they operate at higher capacity and offset more grid electricity. Factories, warehouses, and office buildings use substantial daytime power when solar production peaks, maximizing the carbon displacement per panel. A 500kW commercial rooftop system might prevent 400-600 tons of CO2 annually by replacing fossil fuel generation, effectively “erasing” its manufacturing emissions within 18-24 months. Beyond that payback point, these systems deliver decades of genuinely carbon-negative energy. The economies of scale also matter: bulk procurement and streamlined installation reduce the embedded carbon per watt compared to smaller residential arrays, while consistent high utilization means each panel works harder to justify its initial footprint.
Utility-Scale Solar Farms
Utility-scale solar farms, installations of one megawatt or larger, consistently deliver the lowest carbon footprint per kilowatt-hour produced. These massive arrays achieve carbon intensities around 18-25 gCO2/kWh, roughly half that of residential systems. The advantage comes from scale: centralized manufacturing reduces per-panel transportation emissions, installation crews work more efficiently across thousands of identical mounts, and fixed-axis or tracking systems maximize generation per square foot of infrastructure.
Large solar farms also reach carbon payback faster, often within 12-18 months rather than the 2-4 years typical for rooftop systems. They benefit from bulk purchasing of high-efficiency panels, optimized site selection for solar irradiance, and lower balance-of-system costs per watt installed. Since these facilities operate continuously under professional maintenance, their capacity factors run 20-30% higher than residential arrays, spreading embodied emissions across significantly more clean electricity over the project’s 25-30 year lifespan.
Solar vs. Other Renewable Energy: Putting the Carbon Footprint in Perspective

When you compare solar’s carbon footprint to other renewable energy sources, you quickly realize it sits comfortably in the middle of the pack, not the absolute lowest, but far cleaner than any fossil fuel option. This context matters because choosing renewable energy isn’t about finding perfection; it’s about understanding the real trade-offs.
Wind energy typically produces 7-15 gCO2/kWh over its lifecycle, making it slightly cleaner than solar’s 20-50 gCO2/kWh range. Wind turbines require less manufacturing intensity and use fewer rare materials, though they need more land per megawatt and face geographic limitations. Hydroelectric power clocks in around 6-25 gCO2/kWh depending on reservoir size and methane emissions from flooded vegetation. Large dams can actually produce substantial emissions during construction and early operation, while run-of-river systems stay cleaner.
Nuclear energy achieves roughly 5-20 gCO2/kWh, among the lowest of any energy source, though uranium mining and long-term waste storage add complexity beyond simple carbon metrics. Geothermal sits at 15-55 gCO2/kWh, varying widely based on site conditions and whether operations release naturally occurring underground gases.
The real perspective shift happens when you compare renewables to fossil fuels. Coal-fired power plants emit 820-1,050 gCO2/kWh, natural gas produces 490-650 gCO2/kWh, and even “cleaner” combined-cycle gas plants still hit 350-400 gCO2/kWh. Solar’s worst-case scenario emits 95 percent less carbon than coal and 90 percent less than natural gas.
Within solar itself, thermal solar systems for heating water or air operate at the lower end of the carbon spectrum because they use simpler technology without semiconductor manufacturing. Standard photovoltaic panels require more processing but deliver electricity’s versatility.
The takeaway is clear: arguing about whether wind beats solar by 10-20 gCO2/kWh misses the bigger picture. Any renewable energy source delivers transformational carbon reduction compared to burning fossil fuels, typically cutting emissions by 90-98 percent. Your local resources, roof conditions, and grid mix will matter more than chasing the theoretically cleanest option.
What Affects the Carbon Footprint of Your Solar Installation
Several real-world factors determine the actual carbon footprint of your solar installation, and understanding them helps you make choices that maximize environmental benefits alongside energy savings.
Where Your Panels Are Made
Manufacturing location matters significantly. Panels produced in regions with cleaner electricity grids (like parts of Europe or facilities powered by renewables) have substantially lower embedded emissions than those made in coal-heavy regions. Some manufacturers now disclose their production energy sources, look for this information when comparing options, especially if you’re integrating solar into a broader modern green home design project.
Your Local Energy Mix
The carbon intensity of your regional grid dramatically affects your solar system’s offset value. If you’re replacing coal-heavy electricity, your panels “pay back” their manufacturing emissions faster, often within one to two years. In regions already running on cleaner grids, the payback period extends to three or four years, though you’re still making a meaningful contribution.
System Efficiency and Design
Higher-efficiency panels generate more clean energy per square meter, which means faster carbon payback despite slightly higher manufacturing emissions. Similarly, optimal placement, south-facing in the Northern Hemisphere, minimal shading, appropriate tilt angle, ensures you extract maximum value from your investment.
Making Better Choices
You can actively reduce your installation’s carbon footprint through several practical decisions:
- Choose panels manufactured using renewable energy or in regions with cleaner grids
- Work with installers who optimize system placement to maximize energy production
- Consider your local energy mix when calculating realistic environmental benefits
- Select quality components that last longer, spreading manufacturing emissions over more years of clean energy generation
Installation practices matter too. Local installers typically have lower transportation emissions than distant providers, and professional installation reduces the likelihood of inefficiencies that undermine your system’s performance. These seemingly small factors compound over your system’s 25-plus year lifespan, making thoughtful choices worthwhile.
Common Questions About Solar Energy’s Carbon Footprint

Even with a solid grasp of solar’s lifecycle emissions, you might still have lingering questions about specific scenarios or claims you’ve encountered. Let’s tackle the most common uncertainties people face when evaluating solar energy’s environmental credentials.
How long does it take for solar panels to offset their carbon footprint?
Most solar panels offset their manufacturing emissions within one to four years of operation, depending on local sunlight conditions and the carbon intensity of your regional grid. After that payback period, they generate carbon-neutral electricity for the remaining 20-30 years of their lifespan.
Are solar panels truly “clean” energy if manufacturing creates emissions?
Solar panels are substantially cleaner than fossil fuels over their full lifecycle, producing roughly 20-50 grams of CO2 per kilowatt-hour compared to coal’s 820 grams. The manufacturing emissions are a one-time cost that gets amortized over decades of zero-emission operation.
What happens to the carbon footprint when panels reach end-of-life?
Proper recycling can recover up to 95% of panel materials, significantly reducing the footprint of replacement panels. As recycling infrastructure expands, the lifecycle emissions of solar continue to decrease with each generation of technology.
Does solar’s carbon footprint vary significantly by location?
Yes, panels installed in sunny regions offset more grid emissions per year and achieve faster carbon payback, while those in cloudier areas take longer but still provide net carbon benefits over their lifetime. Your local grid’s current fuel mix also matters, since replacing coal-heavy electricity delivers greater carbon reductions than replacing hydroelectric power.
Another question that surfaces frequently concerns whether solar technology is getting cleaner over time. Manufacturing efficiency has improved dramatically in the past decade, with many facilities now powered partially or entirely by renewable energy themselves. This creates a positive feedback loop where solar panels increasingly offset the emissions from making new panels, steadily lowering the technology’s overall environmental impact.
Some people also wonder if installing a small residential system makes any real difference compared to utility-scale projects. While larger installations do achieve lower per-watt carbon footprints through economies of scale, your home system still delivers meaningful carbon reductions and helps accelerate the broader transition to renewable energy. Every panel installed reduces demand for fossil fuel generation and demonstrates market viability that drives further investment in clean energy infrastructure.
Solar energy stands out as one of the cleanest energy sources available when you look at the complete picture. Yes, manufacturing panels requires energy and creates emissions, but those upfront carbon costs get paid back remarkably fast, typically within one to four years depending on your location and system type. After that payback period, your solar panels generate clean electricity for 25 to 30 years or more, essentially emission-free.
Compare that to fossil fuels, which emit carbon continuously throughout their entire lifecycle, and the environmental advantage becomes crystal clear. Even stacked against other renewables, solar holds its own with a lifecycle carbon footprint that rivals or beats most alternatives.
The environmental case for solar isn’t about perfection. It’s about measurable, significant improvement. Every kilowatt-hour your panels generate replaces electricity that would otherwise come from the grid, and in most places, that grid still relies heavily on fossil fuels. The math works in your favor, and it keeps working year after year.
If you’re considering solar as part of your sustainability journey, you’re looking at a proven technology with a well-documented environmental profile. The carbon footprint is real, manageable, and temporary compared to the decades of clean energy production that follow. That’s a trade-off worth making, backed by data and validated by experts worldwide. Solar isn’t just a step toward cleaner energy, it’s a leap.